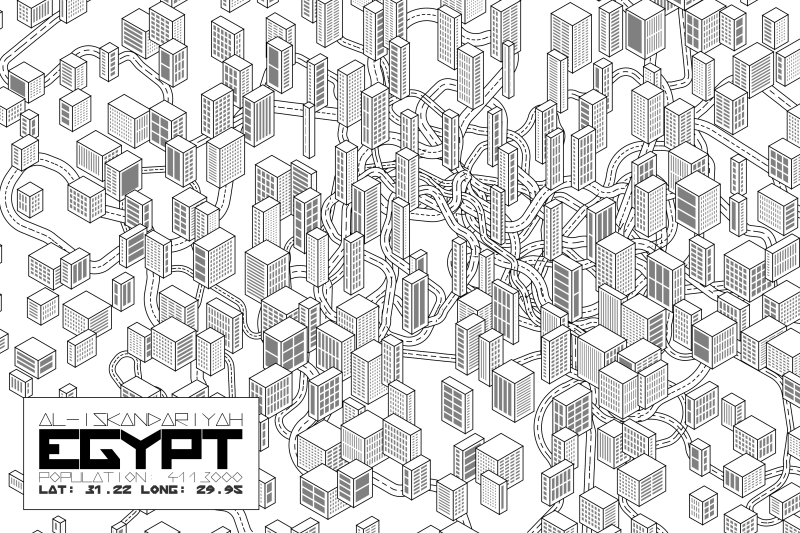
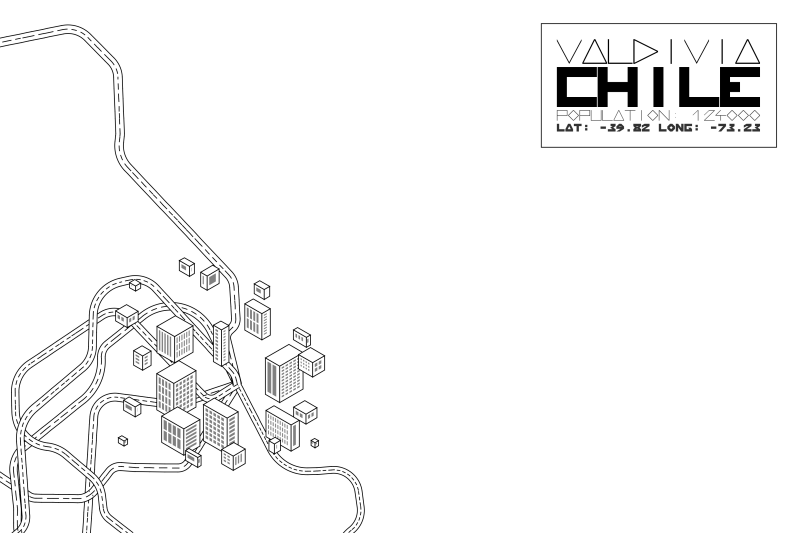
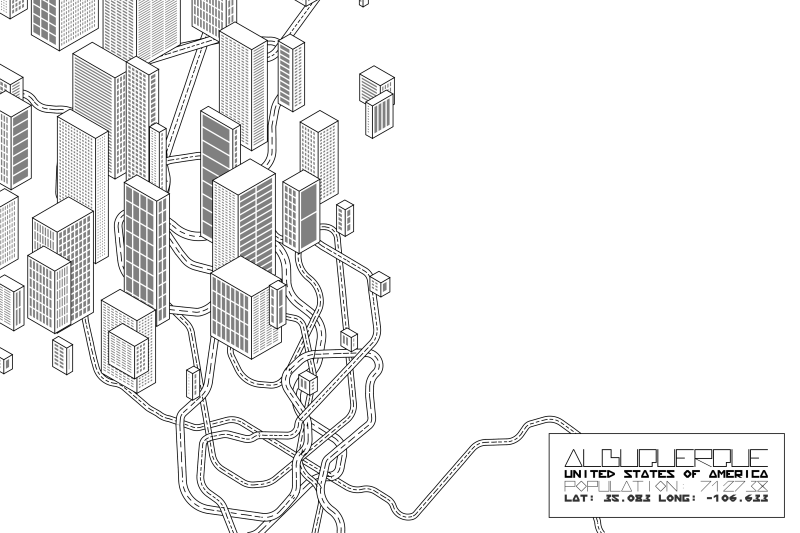
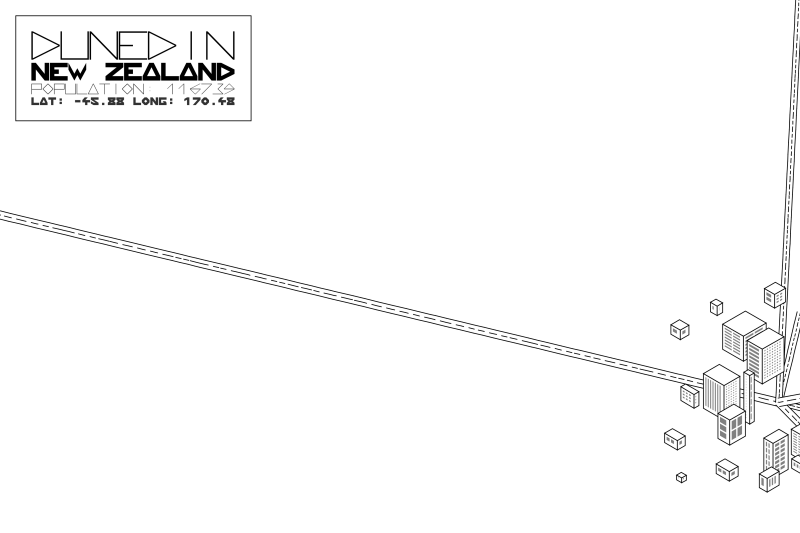
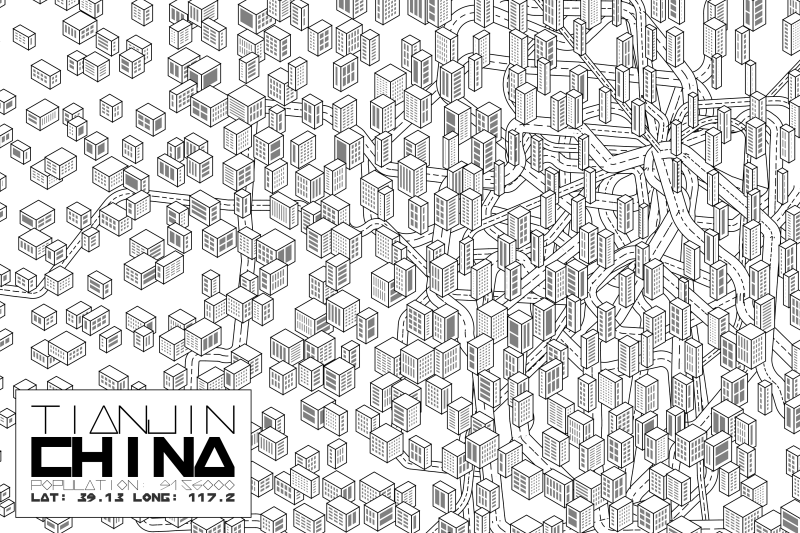
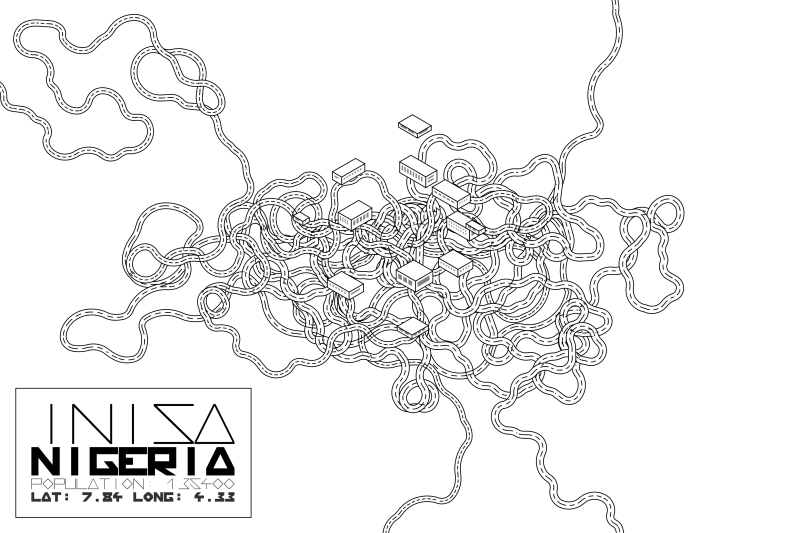
5imcity2000 is a free interpretation of world cities representation.
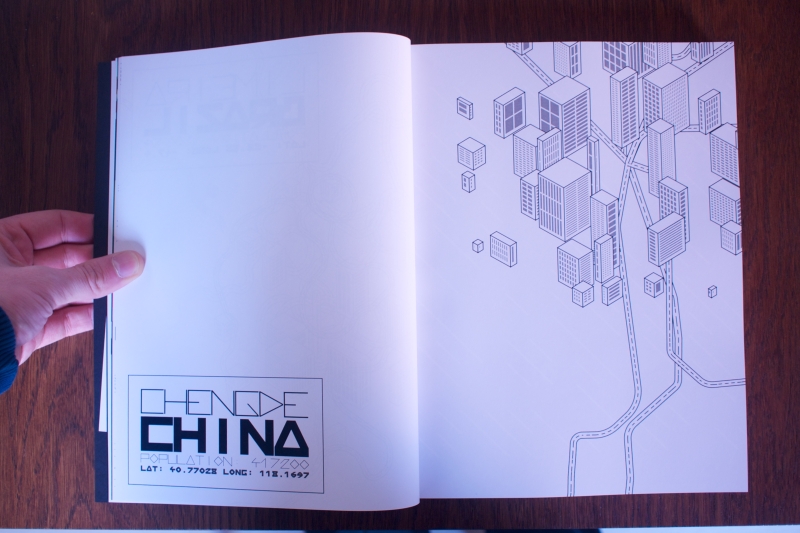
This piece was produced for the WrittenImages project by Martin Fuchs and Peter Bichsel, a generative book that presents programmed images by various artists. Each print in process would then be calculated individually – which makes every single book unique.
5imcity2000 is about representing city data with numbers taken from the year 2000. But it’s also a tribute to Simcity™, a well-known computer game designed by Will Wright in the beginning of the 90’s . The game’s 2000 version, still using a pixel art look, was then a major graphical improvement. The ‘5’ in place of the ‘S’ is a greeting to Ben Fry and Casey Reas who removed it from the Proccessing language name they created and that was used to code this piece.
This piece speaks about my fascination for code, video games, pixel art and procedural cities. It’s part of an ongoing project for which I created pieces of code that would be part of my personal graphic palette. I started by drawing buildings − where buildings would be my paint brush − then I wanted to draw roads…
With this vizualisation, just by using a city location and population, I wanted to see how well could I represent it. How much would these numbers influence it’s appearance?
It’s a bit like drawing the map of a place from the memories you have…
Technical details
The program is written in Processing and takes the data set « World Cities with Population » from Maxmind as an input. The set has been cleaned up to contain only city names, countries, latitude, longitude and population at the year 2000.
A set of graphic functions are used to display buildings and roads. The typography is also a « programmatic » font where each letter is a single closed polygon. There is no graphical element loaded at any time. All is done in Processing code.
Each time the program is called, it randomly picks a city from the database, draws more or less, tall or short buildings and straight or curvy roads according to city’s location and population. It then finishes by writing all city data in a « cartouche ».
Some pieces of code are taken from “Writtenimages framework” by Dave Bollinger and “Blur Circle” by François Zajéga.